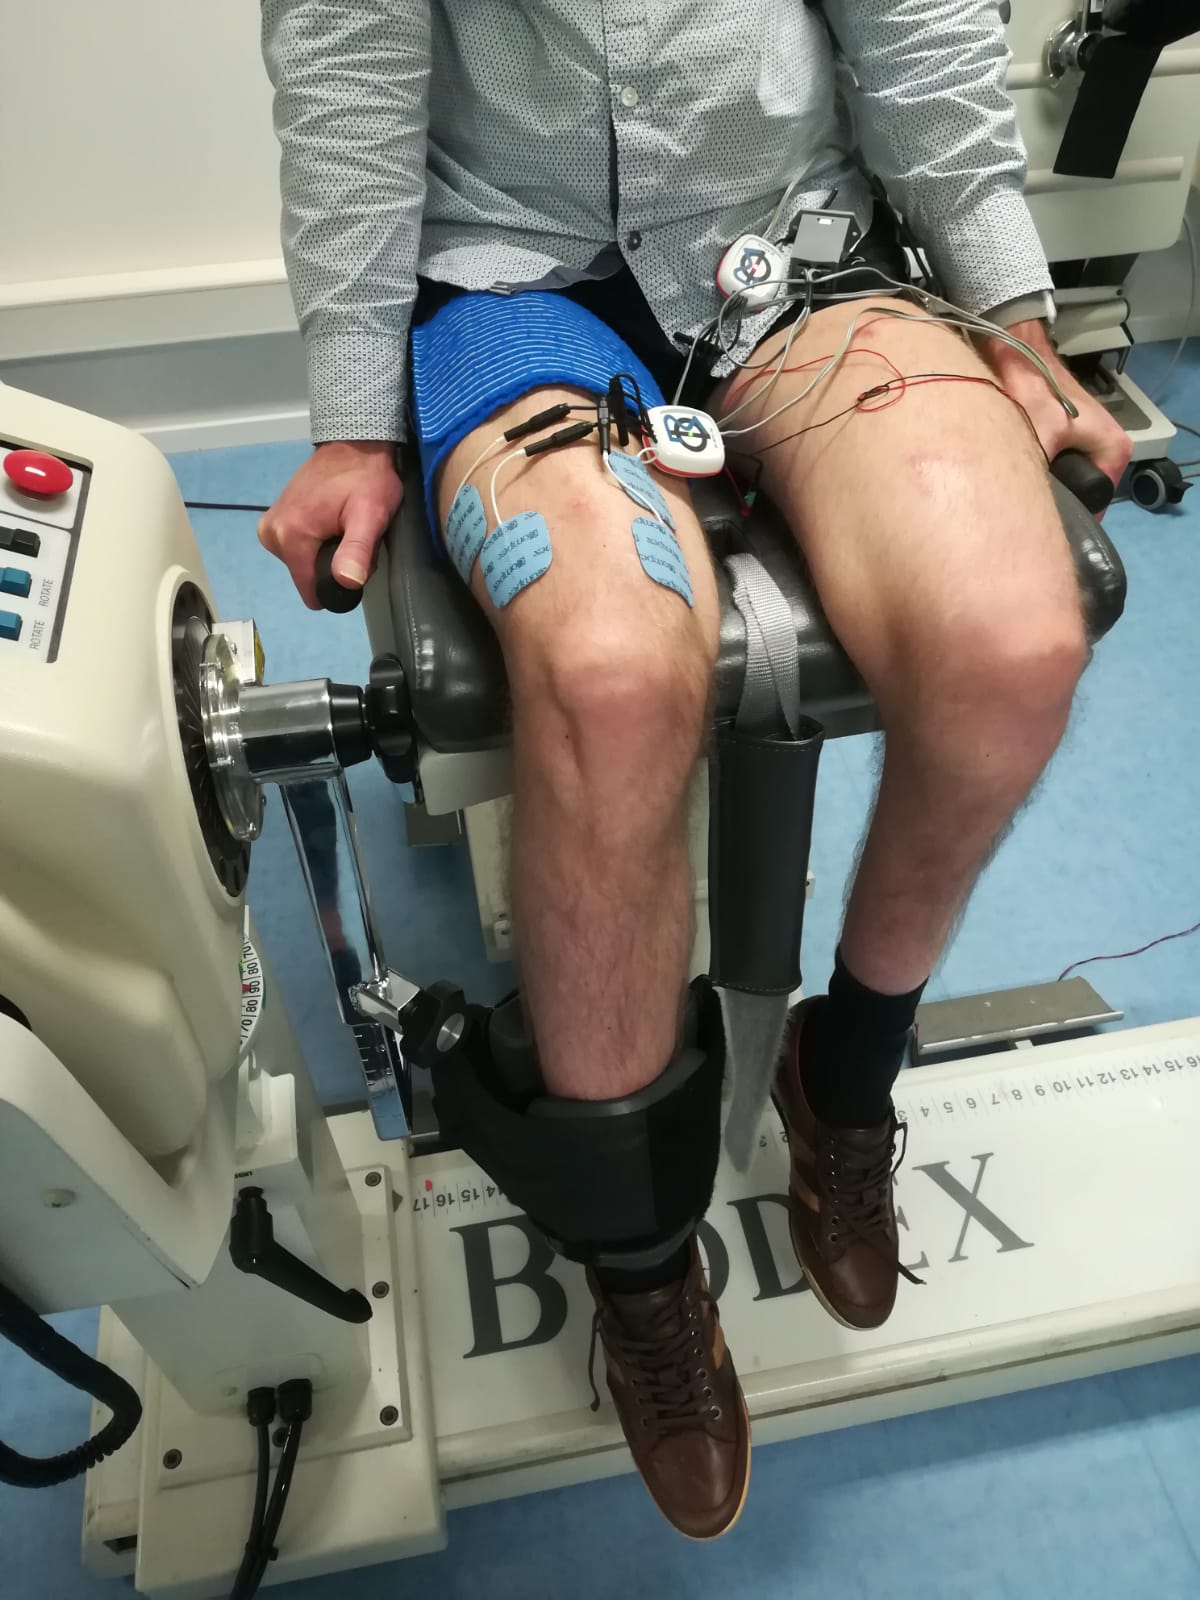
A few weeks ago we went a couple of times to Reade with Sander. With the help of a former team member Vasilis, we investigated the optimal frequency to stimulate the knee extensors. We have been using a splitter which splits the electrical pulses to ensure equal distribution over several electrodes, and expands the area of stimulation. However, this reduces the frequency per electrode. That is why we were curious about the optimal frequency when using the splitter.

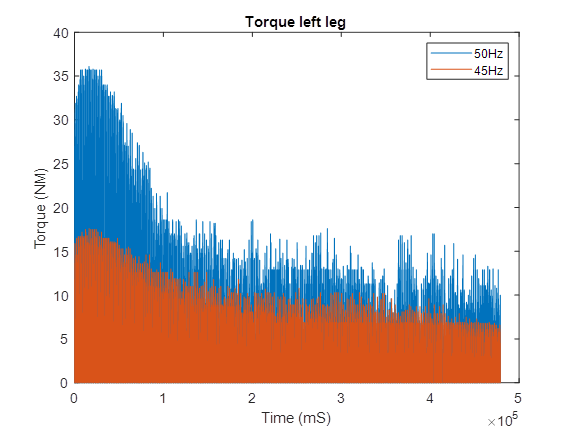
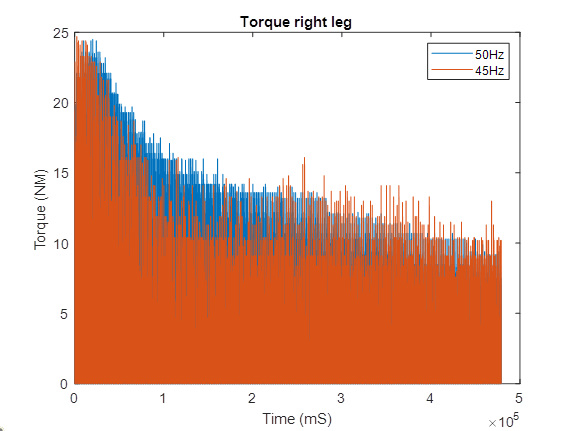
The measurements were made with the Biodex, a device that can map the delivered moment during an isometric (static) knee extension. Both the left and right leg were tested twice once with 50 Hz stimulation and once with 45 Hz stimulation. The measurements were spread over two days so that the muscles had enough time to relax. The frequencies (50 and 45 Hz) were chosen on the basis of a previous “test” study in Reade that we had carried out during the summer holidays. The knee flexors were stimulated with the splitter, using two small electrodes on the inside of the thigh (vastus medialis) and two small electrodes on the outside of the thigh (vastus lateralis). A static contraction was alternated with rest for eight minutes. The moment which the muscles delivered was measured. The graph (graph 1 and 2) below shows the difference in delivered moments between the 50 Hz and 45 Hz stimulations. The difference in moment was larger in the left leg compared to the right leg. In addition, the blue graph shows that the left leg can maintain a larger moment at 50 Hz for a longer time. After calculating the average, the peak moment and the degree of fatigue, it turned out that a larger torque can be delivered at 50 Hz. This would provide the athlete with greater power, more speed and therefore a faster end time while cycling! A side note to this is that we could only stimulate one muscle group during the test. While cycling with FES we want to stimulate 4 muscle groups, but only one can be connected to the splitter. After this test it is not yet clear what the effects of 50 Hz stimulation are on the other muscle groups.


Unfortunately, doing more tests is a bit more difficult during these times. We are therefore looking for alternative test methods to measure this – on distance – remotely.